این نرمافزار یک بستر گرافیکی تحلیل دادهها است که با زبان Python و بهرهگیری از کتابخانههای Tkinter و CustomTkinter برای رابط کاربری، Matplotlib برای مصورسازی دادهها، NumPy و SciPy برای محاسبات آماری و ریاضی، و همچنین python-docx برای تولید گزارشهای Word توسعه یافته است.
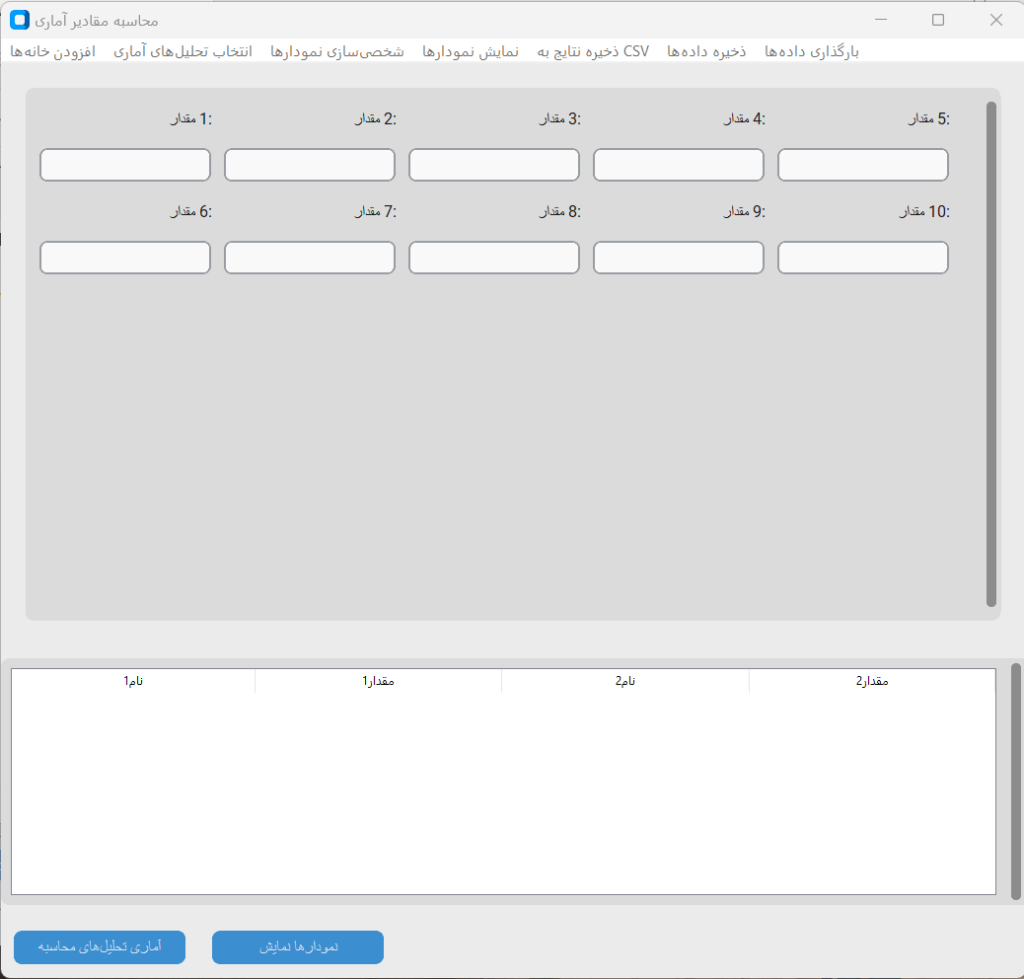
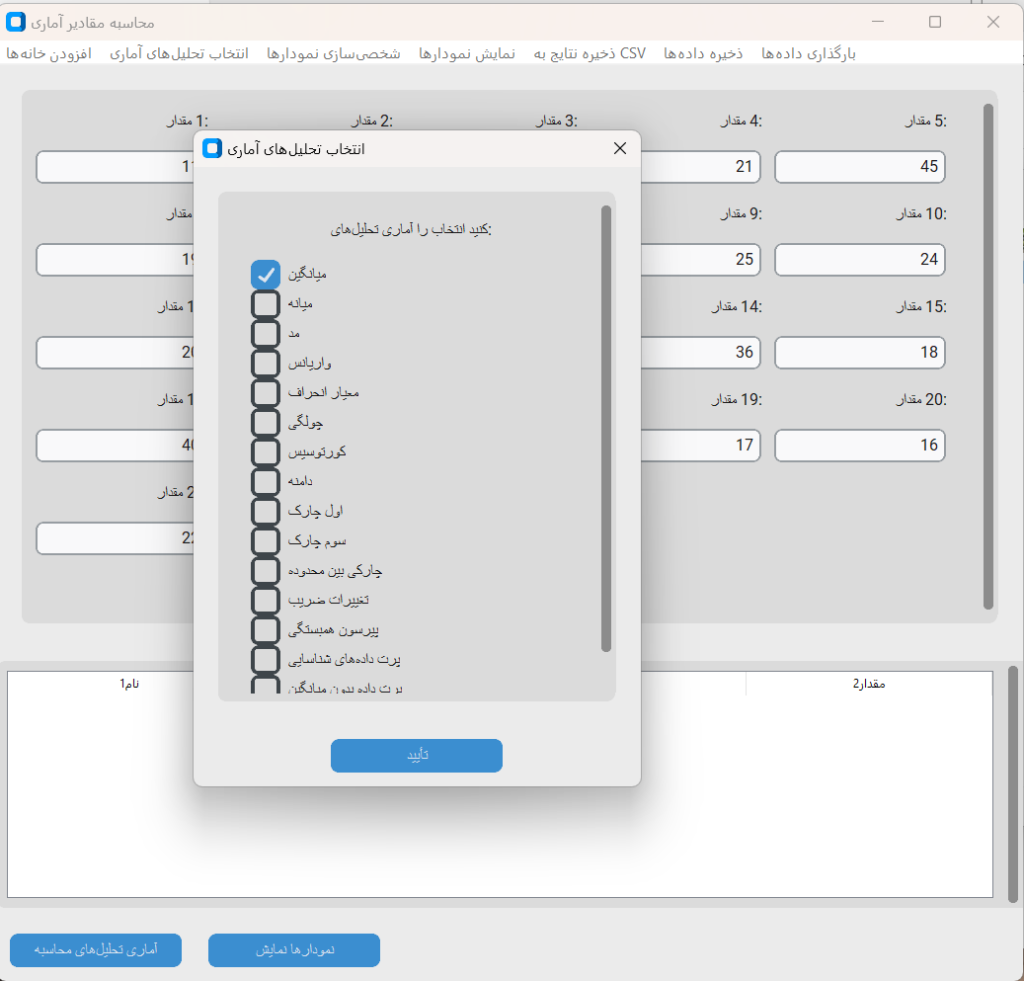
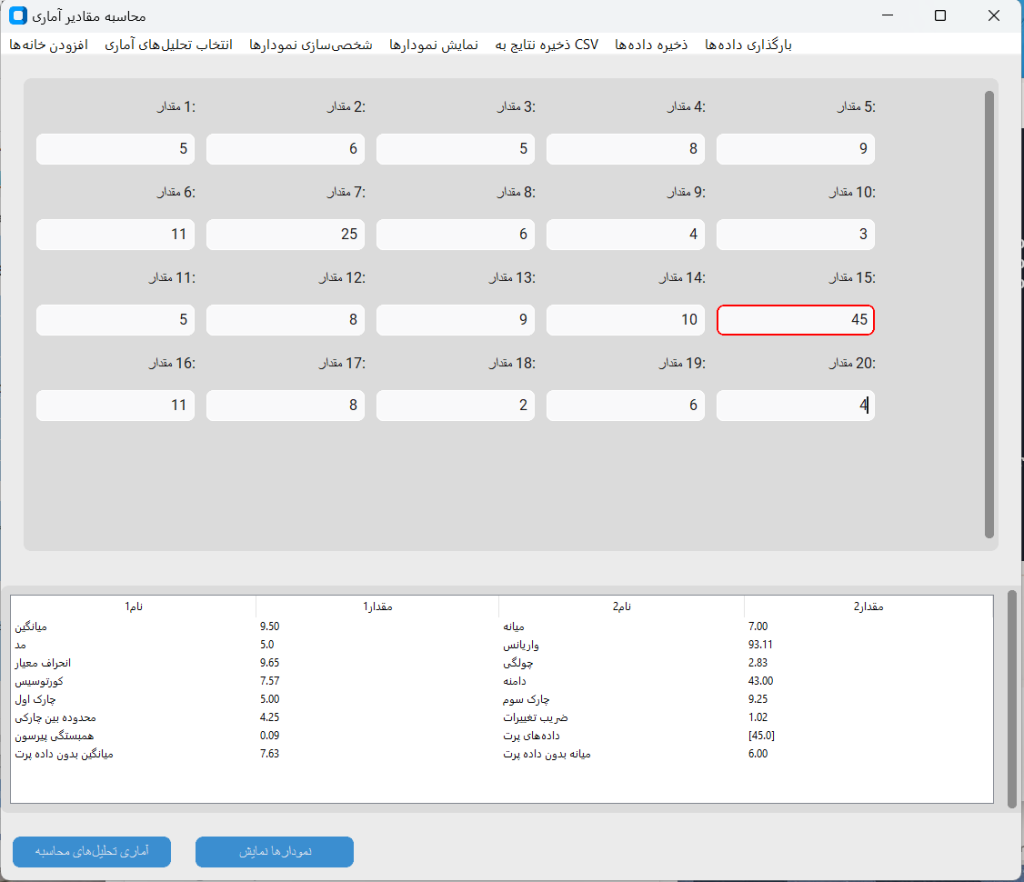
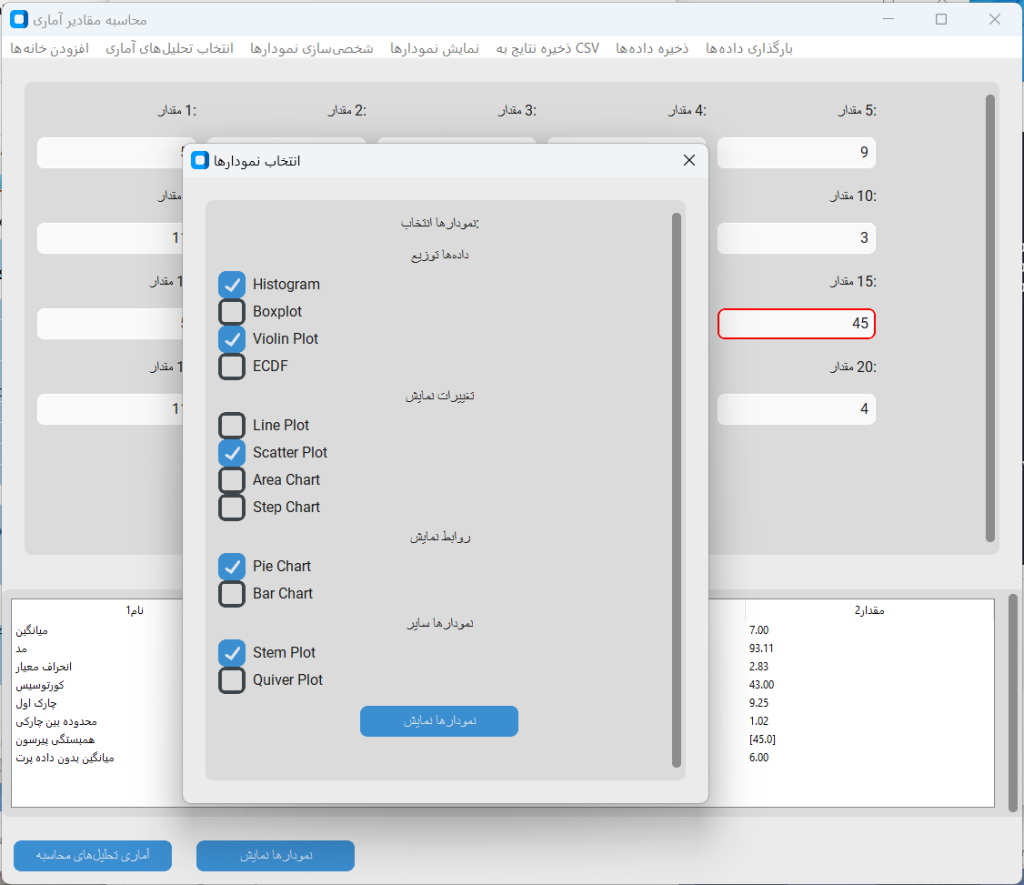
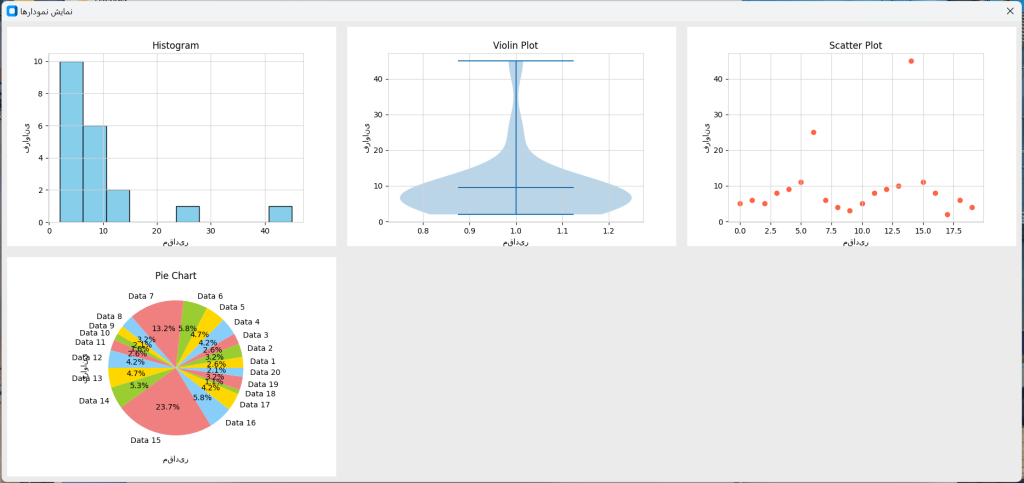
کاربر میتواند دادههای عددی خود را وارد کرده و مجموعهای از تحلیلهای آماری شامل میانگین، میانه، واریانس، انحراف معیار، چولگی، کورتوسیس و شاخصهای دیگر را محاسبه کند. علاوه بر آن، امکان شناسایی دادههای پرت، ترسیم نمودارهای متنوع (هیستوگرام، باکسپلات، نمودار خطی، پراکندگی، پایچارت و …) و ذخیره نتایج در قالبهای CSV، JSON و Word فراهم شده است.
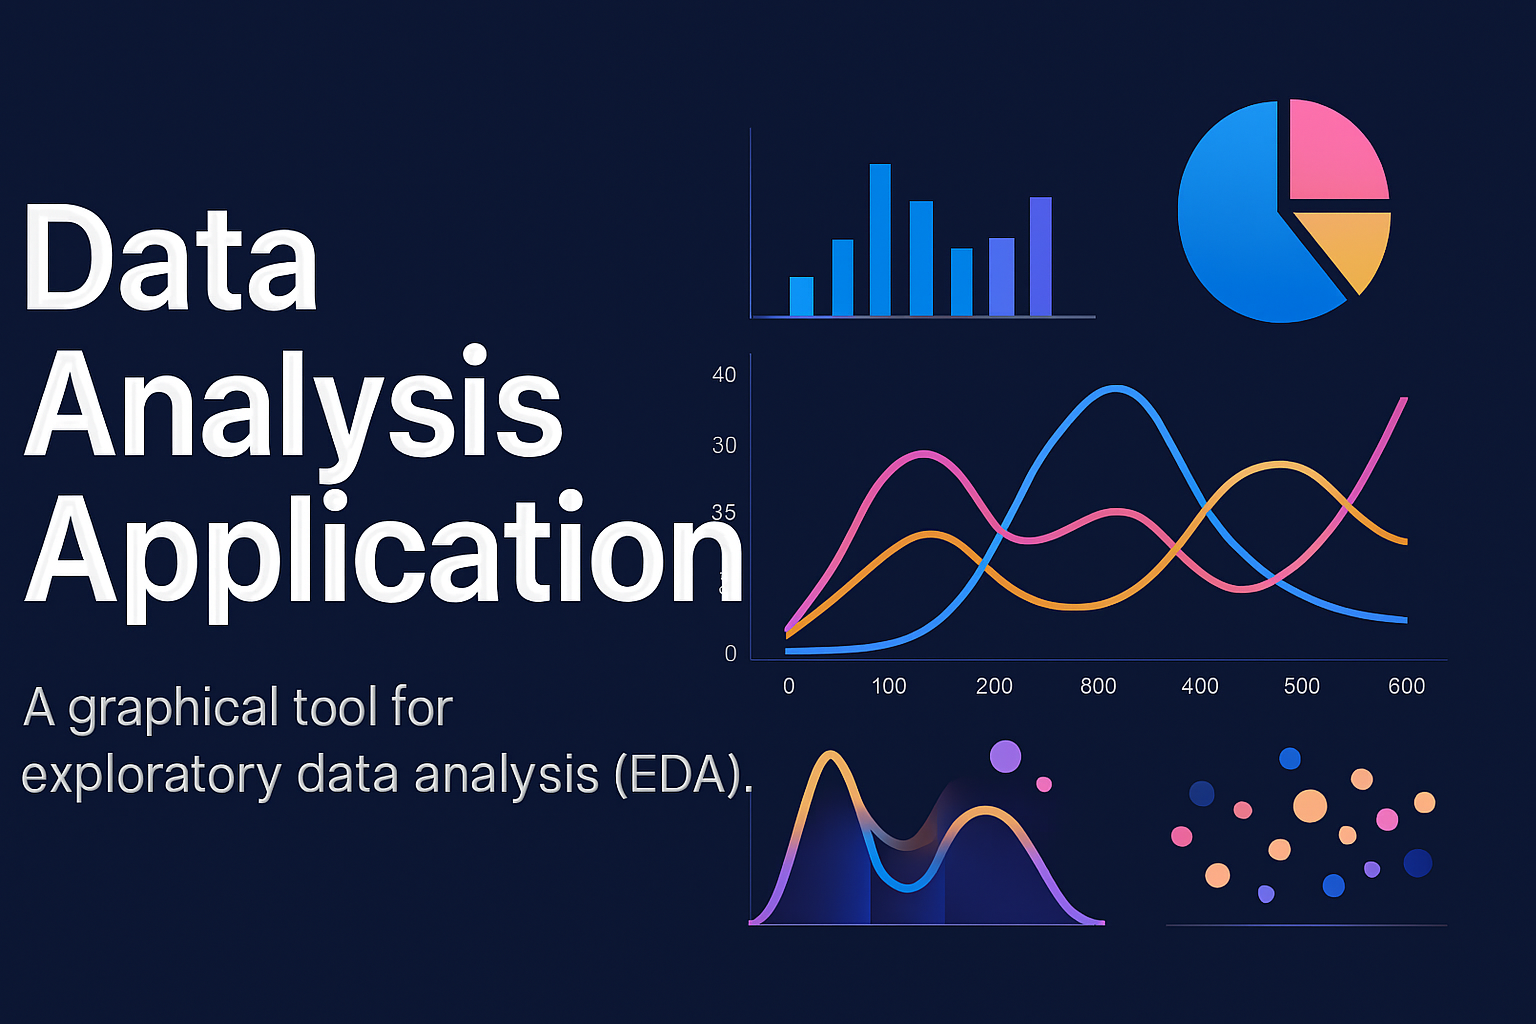
این برنامه بهعنوان یک ابزار EDA (تحلیل اکتشافی دادهها) عمل میکند و میتواند هم برای آموزش مفاهیم آماری و هم برای تحلیلهای کاربردی در پروژههای کوچک و متوسط مورد استفاده قرار گیرد.
This software is a graphical data analysis platform developed in Python, leveraging Tkinter and CustomTkinter for the user interface, Matplotlib for data visualization, NumPy and SciPy for statistical and mathematical computations, and python-docx for generating Word-based reports.
Users can input numerical datasets and compute a wide range of statistical measures, including mean, median, variance, standard deviation, skewness, kurtosis, and more. The application also supports outlier detection, visualization through multiple chart types (Histogram, Boxplot, Line Plot, Scatter Plot, Pie Chart, etc.), and exporting results in CSV, JSON, and Word formats.
Positioned as an EDA (Exploratory Data Analysis) tool, this program is suitable both for educational purposes in statistics and for practical data analysis in small to medium-scale projects.
GitHub Code
https://github.com/keyvan-alavi/DataAnalyzerApp.git
Download
https://technokey.ir/Download/DataAnalyzer.zip
در ادامه، برخی تصاویر از محیط نرم افزار را مشاهده می نماییم